Технологии


Технология ImSca
Полный текст предоставляется по запросу
The ImSca (©NATI Research) is the technology, aim of which is to analyse particle-by-particle a whole surface of SEM specimen in automated mode in order to distinguish the mineral species, calculate their weight proportions, association, liberation, grain size distribution, element distribution and some other mineralogical properties. The technology is realized in software-hardware system, which is an add-on to a scanning electron microscope (SEM).
The technology is very powerful tool in cases when the whole surface of SEM specimen has to be scanned for grain/phase search or for phase/element mass balance, or phase liberation-association analyses, or phase grain size distribution or etc. Such purposes are very important to be studied, for example, in beneficiation studies, process adjustment (grade/recovery rise), quality control, prospecting/exploration, scientific research and many others. The technology is built so, that the system works in automatic mode since the set up is done. That saves time, money and human resources. The technology becomes even more powerful when it is being used in combination with ppm-mineralogy technology.
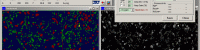
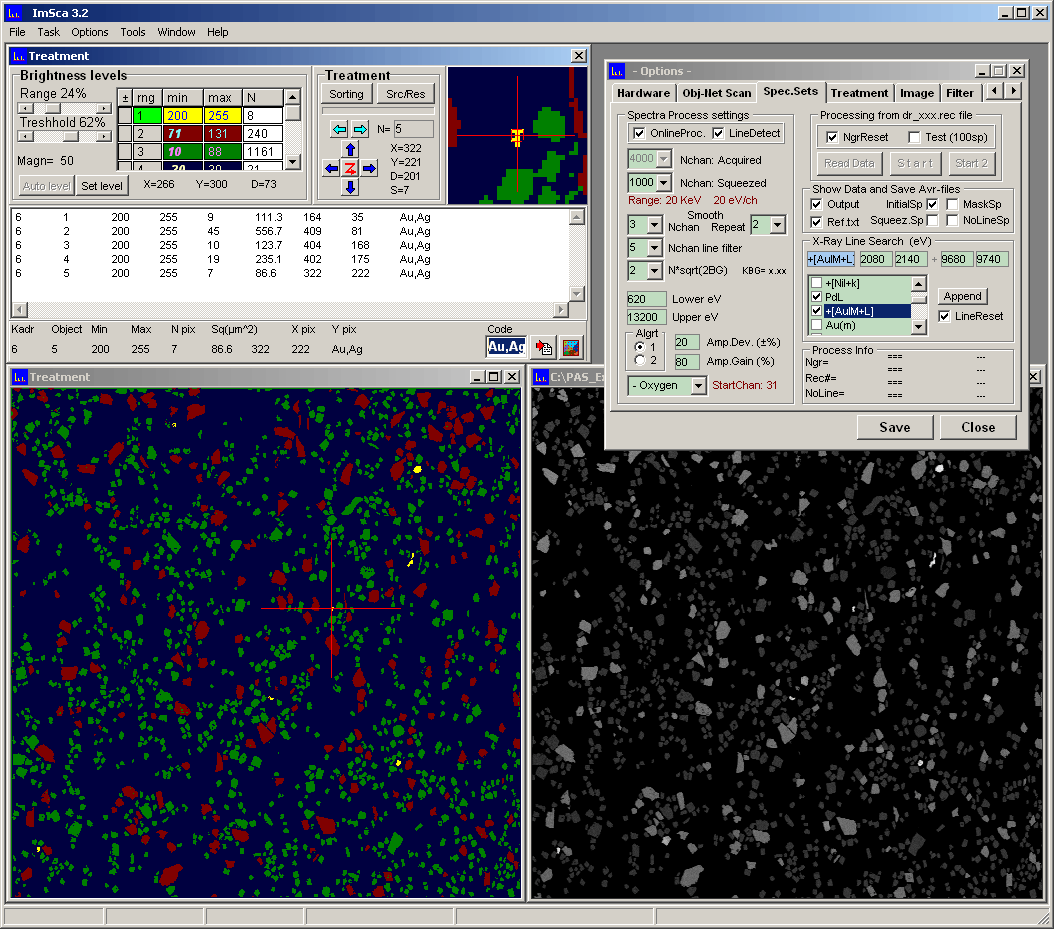 Figure IS1. Image processing of BSE frame with followed by X-ray collection.
|
The basic principles of the technology are image analyses in combination with X-ray spectrometry as well as total automation of whole process. The work of the software-hardware system according to the technology is built on strict sequence of jobs, which are going on fully or partly automatically (depends from the task) both sequentially and simultaneously.
Immediately after the operator (scientist) sets up the appropriate measurement modes and parameters in order to get complete results in shortest time frame and in accordance with the task, the system starts its work in automatic mode without human concern. As it can be seen from Figure IS1, first, the system collects BSE image from a first frame. Then, each unique grain is being segmented into phases with followed by assignment of false colors to each of the phase. At that stage, the system does the de-agglomeration procedures, which secure the separate particles from wrong interpretation of touching. Further, the system collects X-ray data from each phase by single point or by multiple points or by both (depends from the sample specificity and the task). While the X-rays from next point are being collected the system handles data from previous point (time saving). Simultaneously, the system does comparison of each X-ray data to those in standard library. The library as well, is being generated automatically within the process by adding the each unique chemistry data as a new entry in the list. All that process repeats on every frame until the whole specimen surface is being analyzed. After all frames are processed and standard list is generated, the systems work is done, and operators work starts.
The operators work is to extract necessary data in appropriate view for the reporting. The data processing starts from the diagnostics (naming) of each mineral species, which were generated by system with followed by grouping of the minerals (if necessary). Then the data are being reported into the tables, graphs and diagrams. Some examples of such report data are shown on Figures IS2-5.
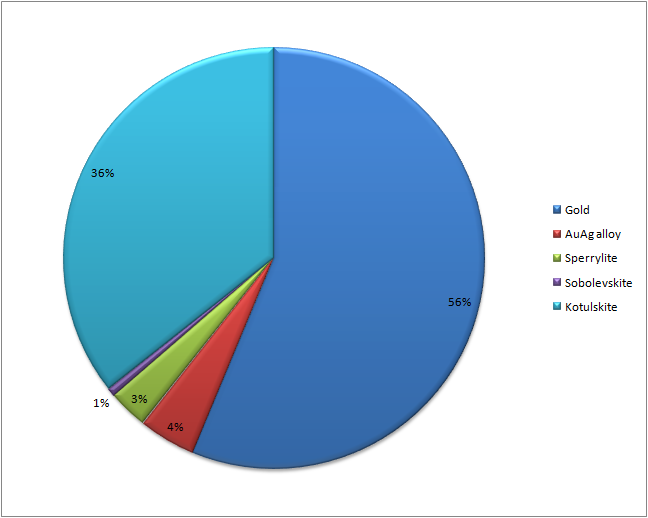 Figure IS2. Modal/PGM Association.
|
 Figure IS3. PGM Liberation.
|
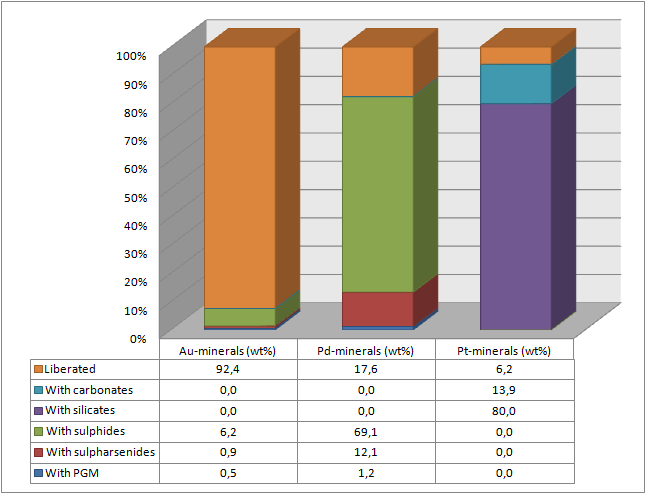 Figure IS4. PGM Association.
|
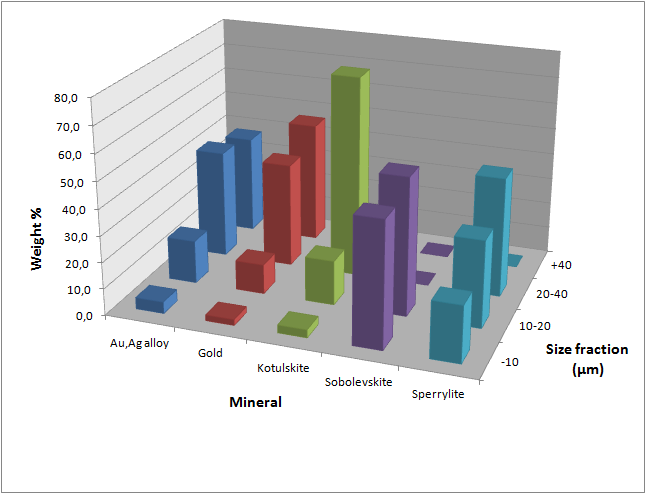 Figure IS5. PGM grain saize distribution into fractions.
|